
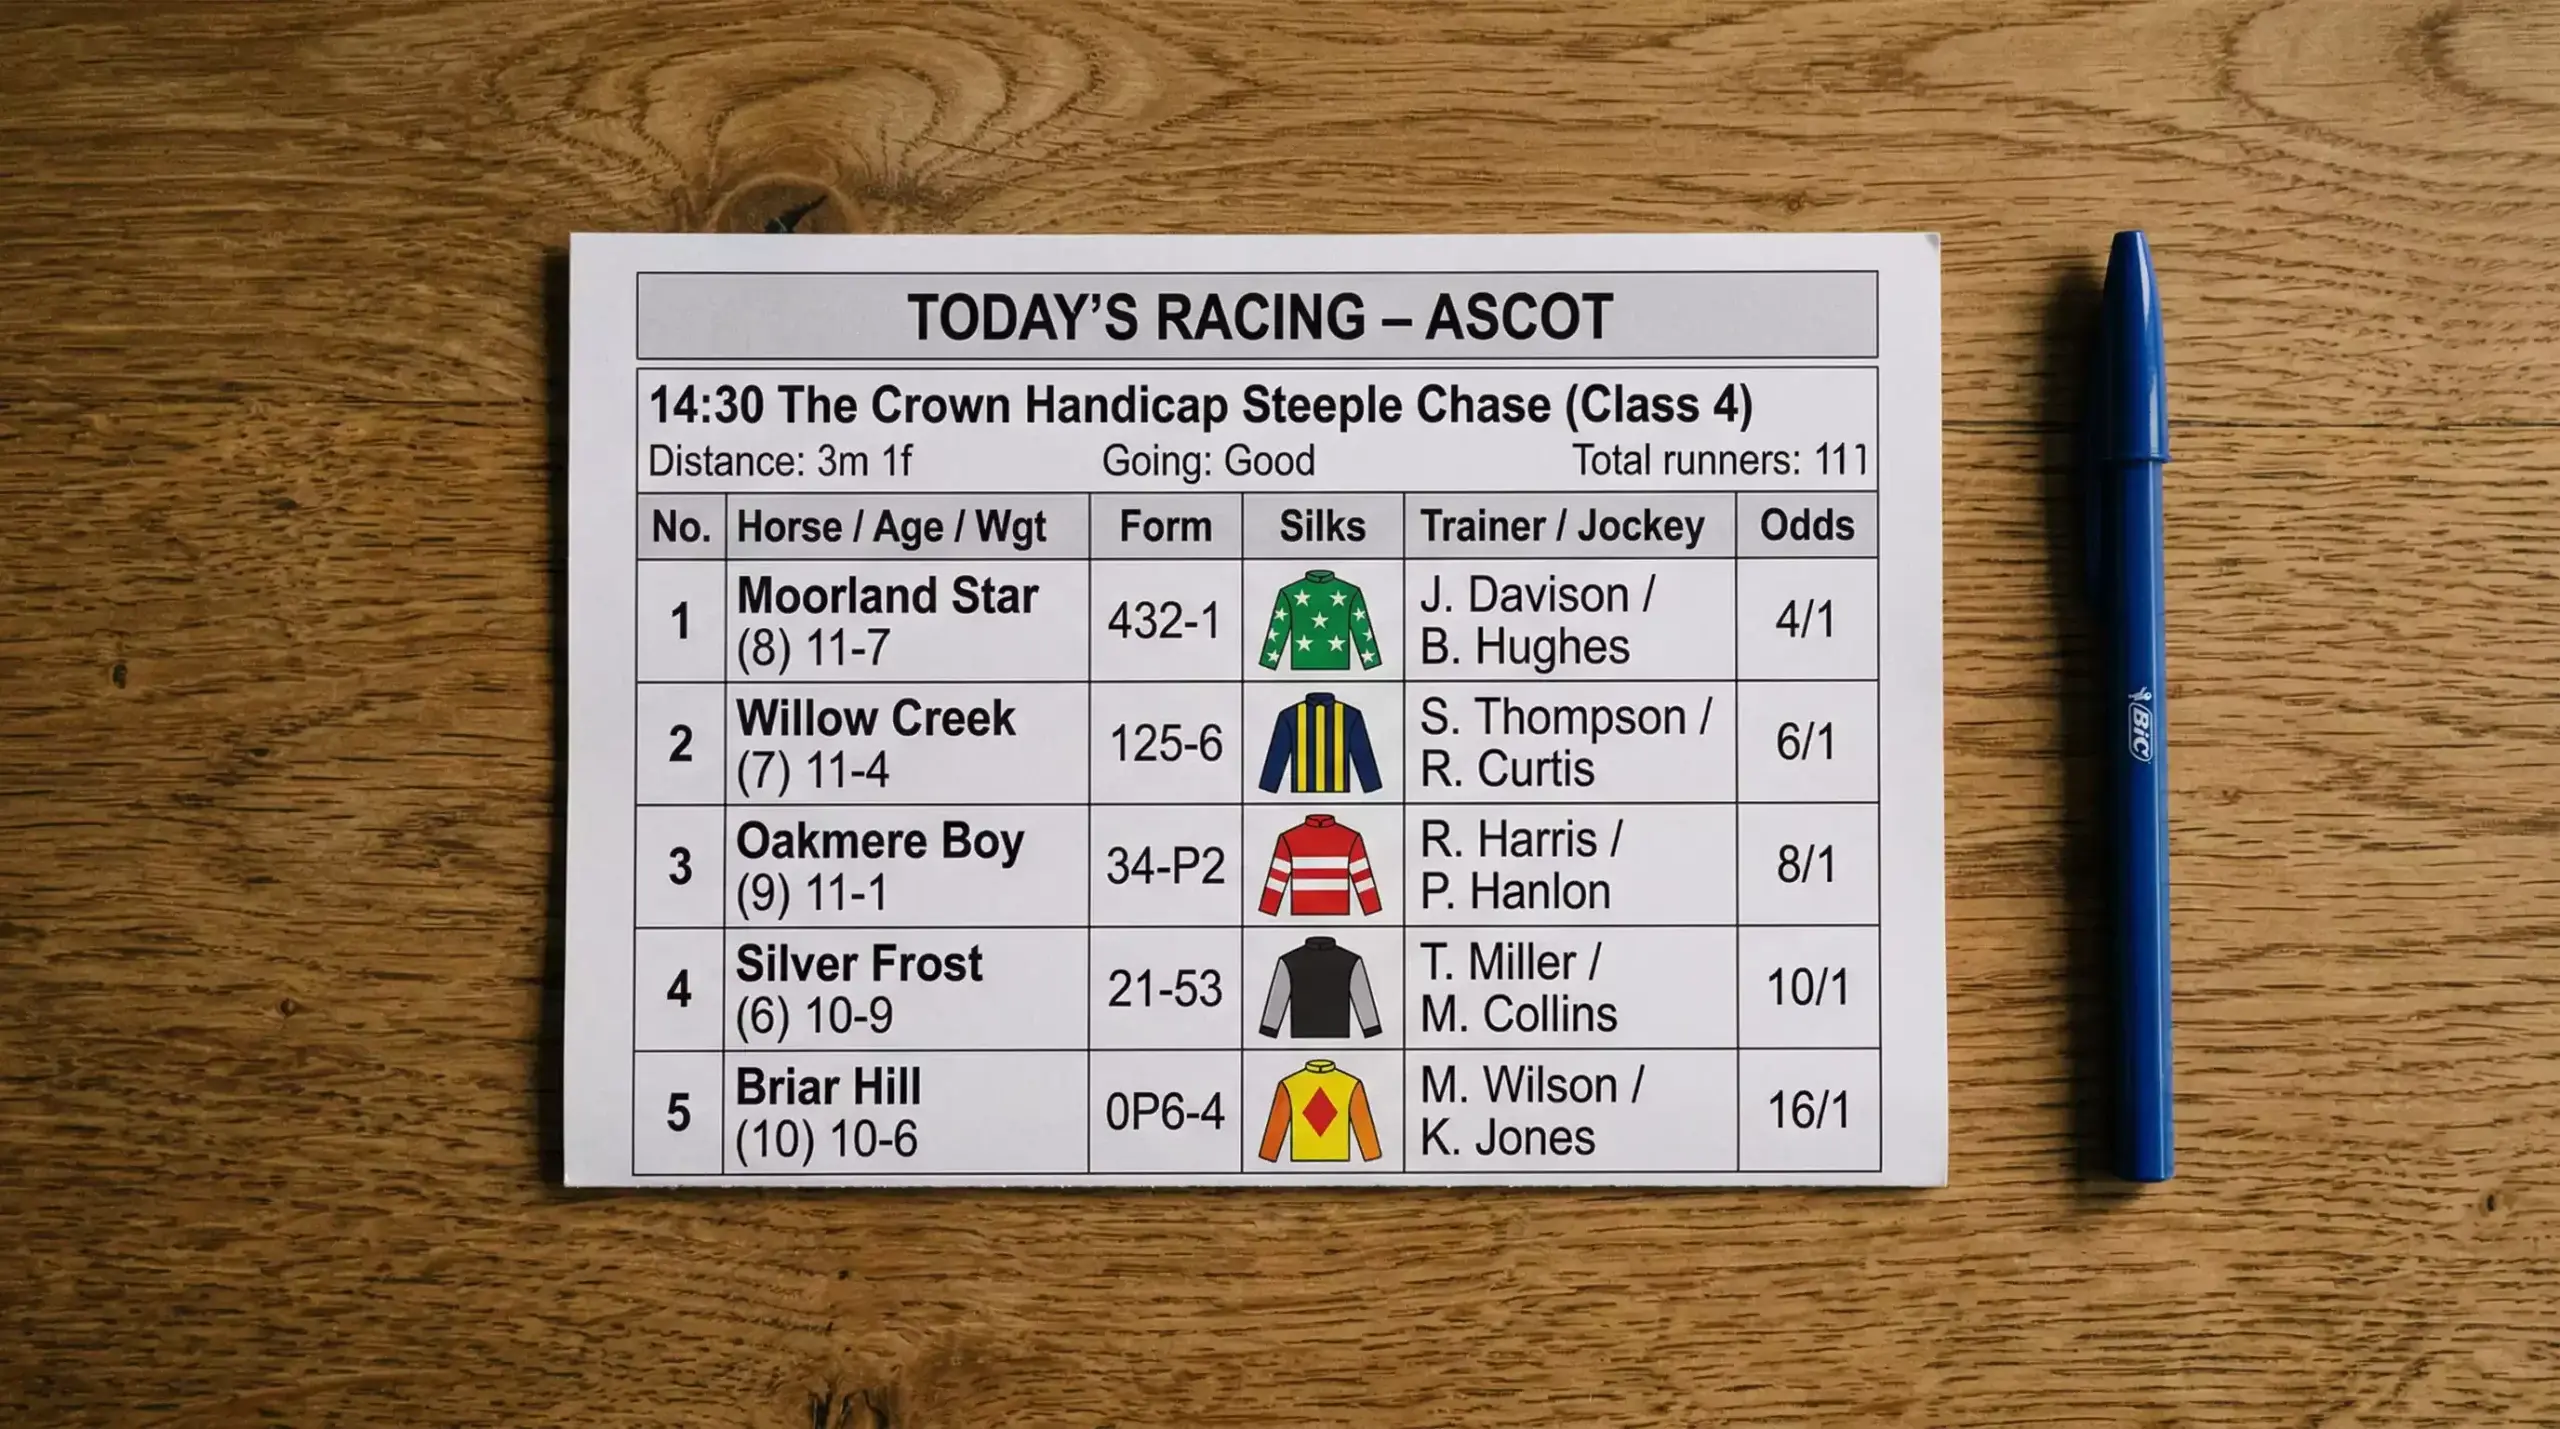

The first time I opened a racecard — properly opened one, not just glanced at the colours — I thought someone had handed me a page of code. Numbers, letters, abbreviations, tiny symbols crammed into rows that seemed designed to intimidate newcomers. That was about nine years ago, and today I cannot imagine placing a bet without spending at least five minutes with the card. Every serious punter I know says the same thing: the racecard is where the real work happens.
A racecard is a compressed information sheet for every runner in a race. It tells you the horse’s recent history, the people responsible for it, the conditions it will face, and a set of numerical ratings that attempt to rank its ability. Once you know what each field means, reading a racecard becomes second nature — and it gives you an immediate advantage over anyone betting on gut feeling alone.
Anatomy of a Racecard
I keep a laminated mini-guide pinned above my desk that I made for a friend who was starting out. It breaks the racecard into zones, and that structure is the easiest way to learn it. Every racecard in Britain, whether printed at the course or displayed on a betting app, contains the same core information, though the layout varies slightly between providers.
At the top of each card you will find the race details: the course name, race time, distance, race class, prize money, and the official going description. These are not decoration. The distance tells you whether you are looking at a sprint (five or six furlongs on the flat) or a stamina test (three miles over fences). The class — ranging from Class 1 at the top to Class 7 at the bottom in flat racing — indicates the quality of the field. A horse dropping from Class 2 to Class 4 is being aimed at weaker opposition, which is a positive signal. A horse climbing in class faces a stiffer test.
Below the race header, each horse gets its own row. The core fields are: the horse’s name, age, weight carried, draw (flat races only), form figures, the trainer, the jockey, the owner’s silks, the official rating (OR), and often a series of symbols indicating headgear, tongue ties, or first-time equipment changes. Some cards also include Racing Post Ratings, Topspeed figures, or sectional timing data, but these are supplementary.
The cloth number appears first — this is the number on the horse’s saddlecloth and makes it easy to identify on the course. Next to it, in many cards, you will see a bracketed number indicating the stall draw. Weight is given in stones and pounds; a horse carrying 9st 2lb is literally bearing nine stone and two pounds on its back, including the jockey and saddle. In handicaps, these weights differ by design — the handicapper assigns more weight to better-rated horses to level the field.
Every element on the card exists because it influences the outcome. Ignore any of them and you are betting with incomplete information. That said, you do not need to master every field at once. Start with form, going, and class — those three carry the most predictive weight for beginners.
Decoding Form Figures and Run History
I once backed a horse because its recent form read “1121” and I thought, “four runs, three wins, obviously good.” It finished eighth. What I had missed was that those runs had all been on heavy ground, and the day’s going was good to firm. The form figures told me part of the story, but not the whole story.
Form figures are read from left to right, with the most recent run on the far right. A “1” means the horse won, “2” means second, and so on down to “9.” A “0” means the horse finished tenth or worse. Letters carry specific meanings: “F” is a fall, “U” is an unseated rider, “P” is pulled up (the jockey stopped riding because the horse was struggling or injured), “R” is a refusal at a fence, and “B” is brought down by another horse’s fall. A slash “/” separates different seasons, so you can see at a glance how recent the runs are.
The number of horses in training across Britain sits around 15,070 at any given time, and each of them accumulates form that tells a distinct story. What makes form interpretation tricky is context. A “3” behind a future Group 1 winner is a far better performance than a “1” in a weak seller. This is why experienced punters look beyond the raw figures and check who the horse was beaten by, how far back it finished, and what the race conditions were.
A useful shortcut for beginners: look at the last three runs. If all three show single-digit finishes on similar ground and at a similar distance to today’s race, the horse is at least competitive in this kind of contest. If the form includes a string of “0”s and “P”s, the horse is either out of form or being tried at the wrong level.
Some racecards display additional codes next to the form. A superscript “C” or “D” indicates the horse has won at this course or over this distance before. A “CD” horse returning to a track where it has already won is a pattern worth noting. BHA data shows that 87.6% of UK races in early 2025 started within two minutes of scheduled time — a detail that matters because some horses become agitated during long delays, and their form at courses with a history of late starts can be unreliable.
Official Ratings, Draw and Weight
Three numbers on the racecard trip up newcomers more than anything: the official rating, the draw position, and the weight carried. They are connected, and understanding the relationship between them is where form reading starts to feel like analysis rather than guesswork.
The official rating (OR) is a number assigned by the BHA handicapper that represents the horse’s assessed ability. A flat horse rated 100 is significantly better than one rated 70. In handicap races, the rating determines the weight: higher-rated horses carry more, lower-rated horses carry less. The goal is to equalise the field so that, in theory, every horse has an equal chance. In practice, handicaps are imperfect, and spotting a horse whose ability exceeds its current rating — a “well-handicapped” runner — is one of the most reliable edges in racing.
Draw position matters on flat courses with tight bends or short run-ins, where the starting stall can give a horse a natural advantage. At Chester, for example, low draws (closer to the rail) have a significant statistical edge over high draws in sprints. At Ascot’s straight course, the picture is less clear-cut. The key point is that draw bias varies by course and distance, and the racecard gives you the draw number without telling you whether it is good or bad. You need course-specific data for that, and most racing websites publish draw statistics for free.
Weight in non-handicap races is set by the race conditions — typically based on age, sex, and whether the horse has won before. In handicaps, the spread can be as wide as two stone between the top weight and the bottom weight. Every pound matters at the margins. A widely cited rule of thumb suggests that one pound of weight equates to roughly one length over a mile, though the real figure depends on the going, the distance, and the quality of the field.
Trainer and Jockey Statistics Worth Checking
A friend of mine bets almost exclusively on trainer patterns. He tracks which trainers target specific courses, which ones perform above expectation with first-time tongue ties, and which ones peak at certain points of the season. His approach is not glamorous, but his P&L is consistently better than punters who focus only on the horse.
The trainer’s name on the racecard is more than a label. Trainers have distinct patterns: some excel with two-year-olds, others specialise in staying chasers. A trainer’s overall strike rate — the percentage of runners that win — is a useful baseline. Anything above 15% on the flat is respectable; above 20% is elite. In National Hunt, where the hit rate is naturally lower because of falls and the unpredictability of jumping, 12-15% marks a strong operation.
Jockey bookings also contain information. When a top jockey is booked for a horse at a minor midweek meeting, it often signals the trainer expects a bold run. Jockey-trainer combinations are worth tracking too — certain partnerships produce win rates well above either individual’s average, because the jockey understands the trainer’s horses and the trainer trusts the jockey’s tactical decisions.
What the racecard does not tell you is the stable’s recent form in aggregate. A trainer sending out five winners from ten runners in the past fortnight is in a different place than one who has gone 0 from 30. That context sits outside the card and requires a quick check of trainer statistics on any reputable racing data site.
